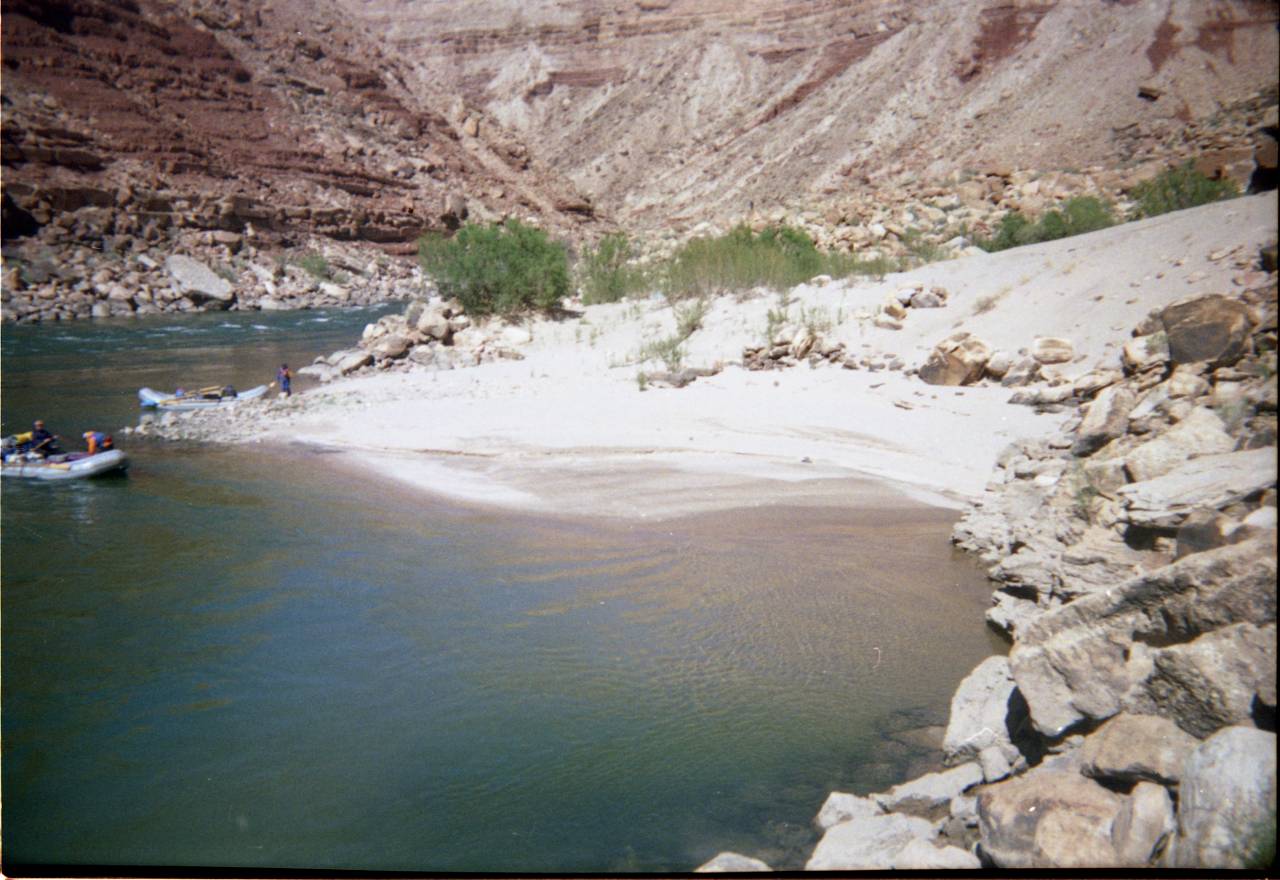
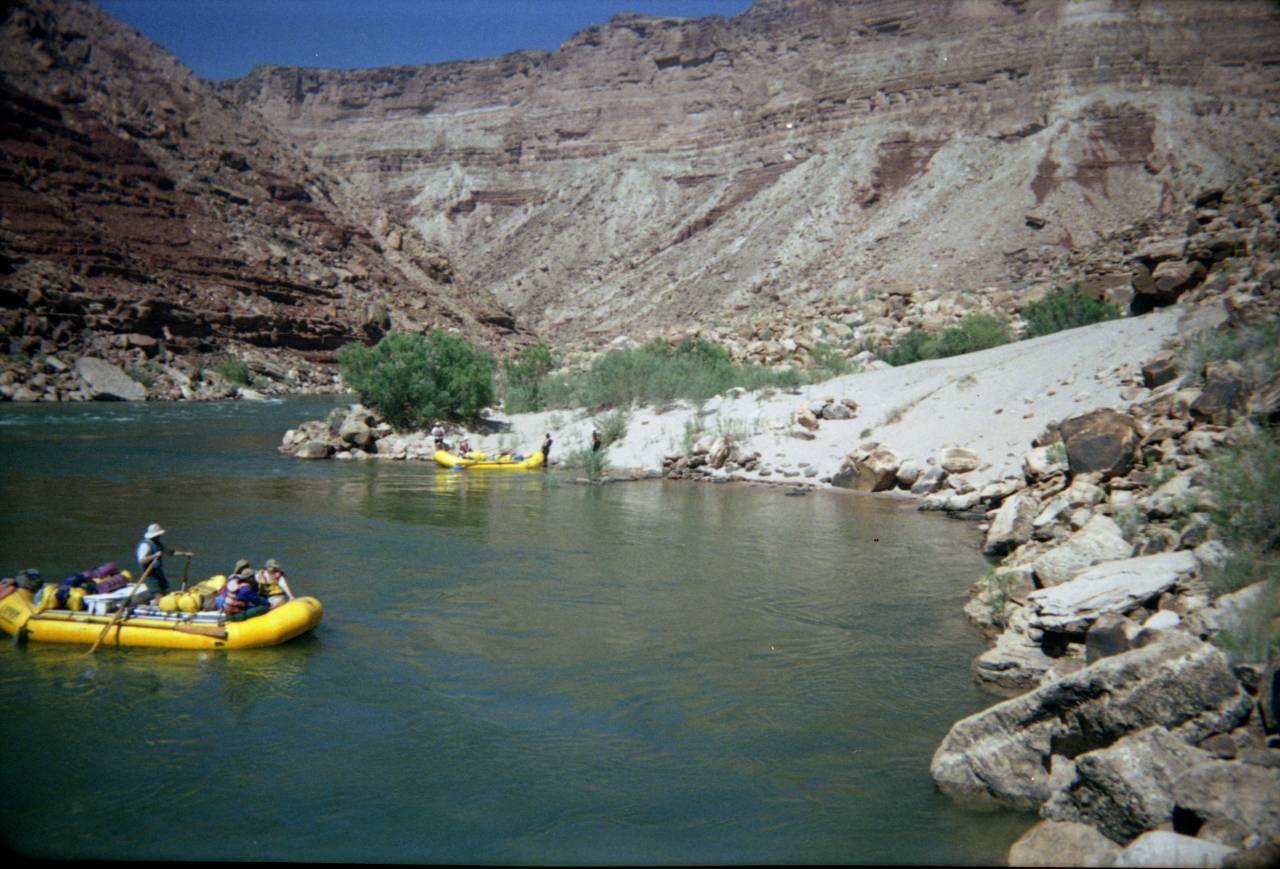
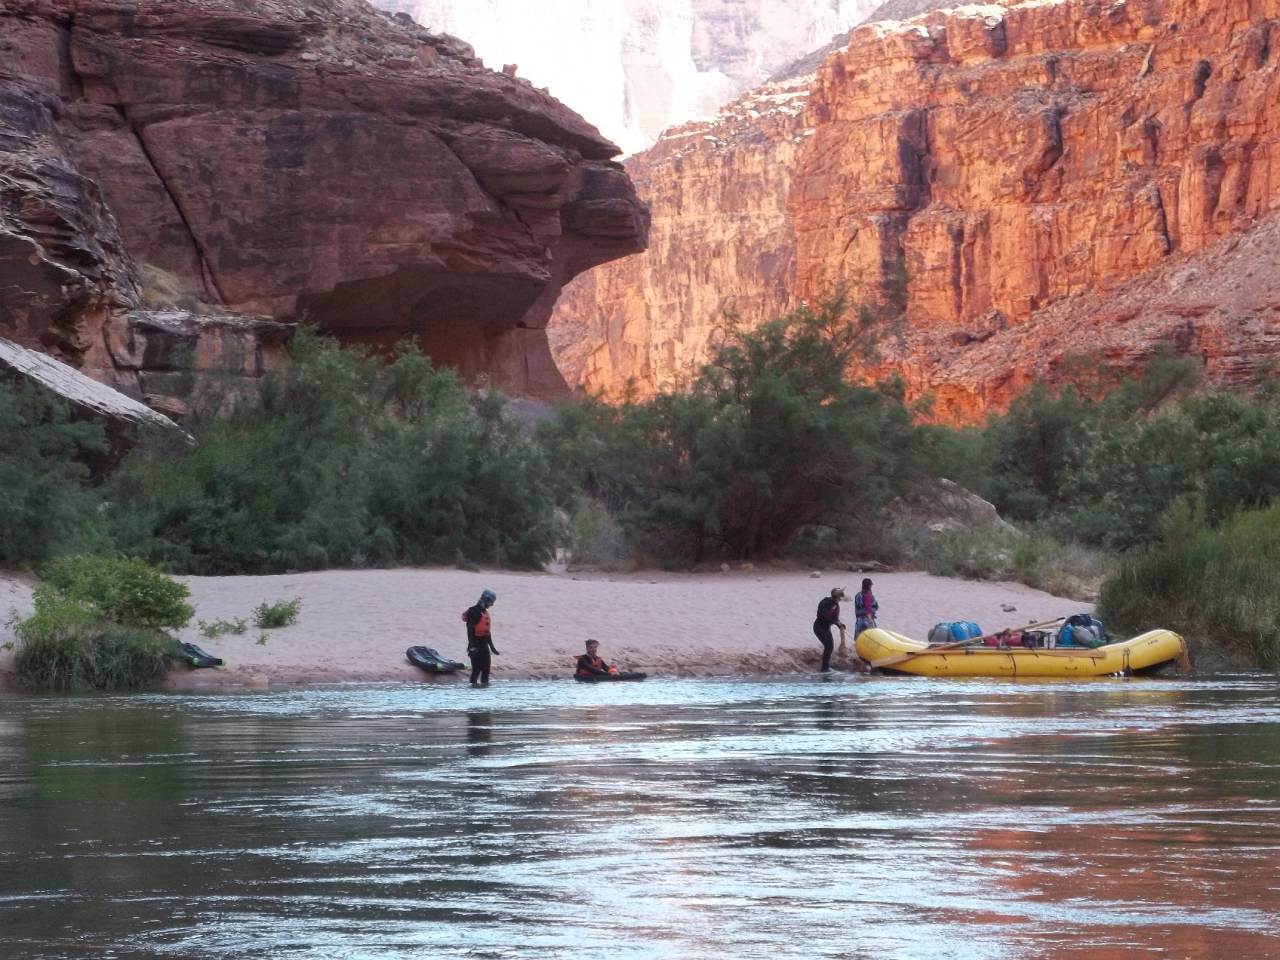
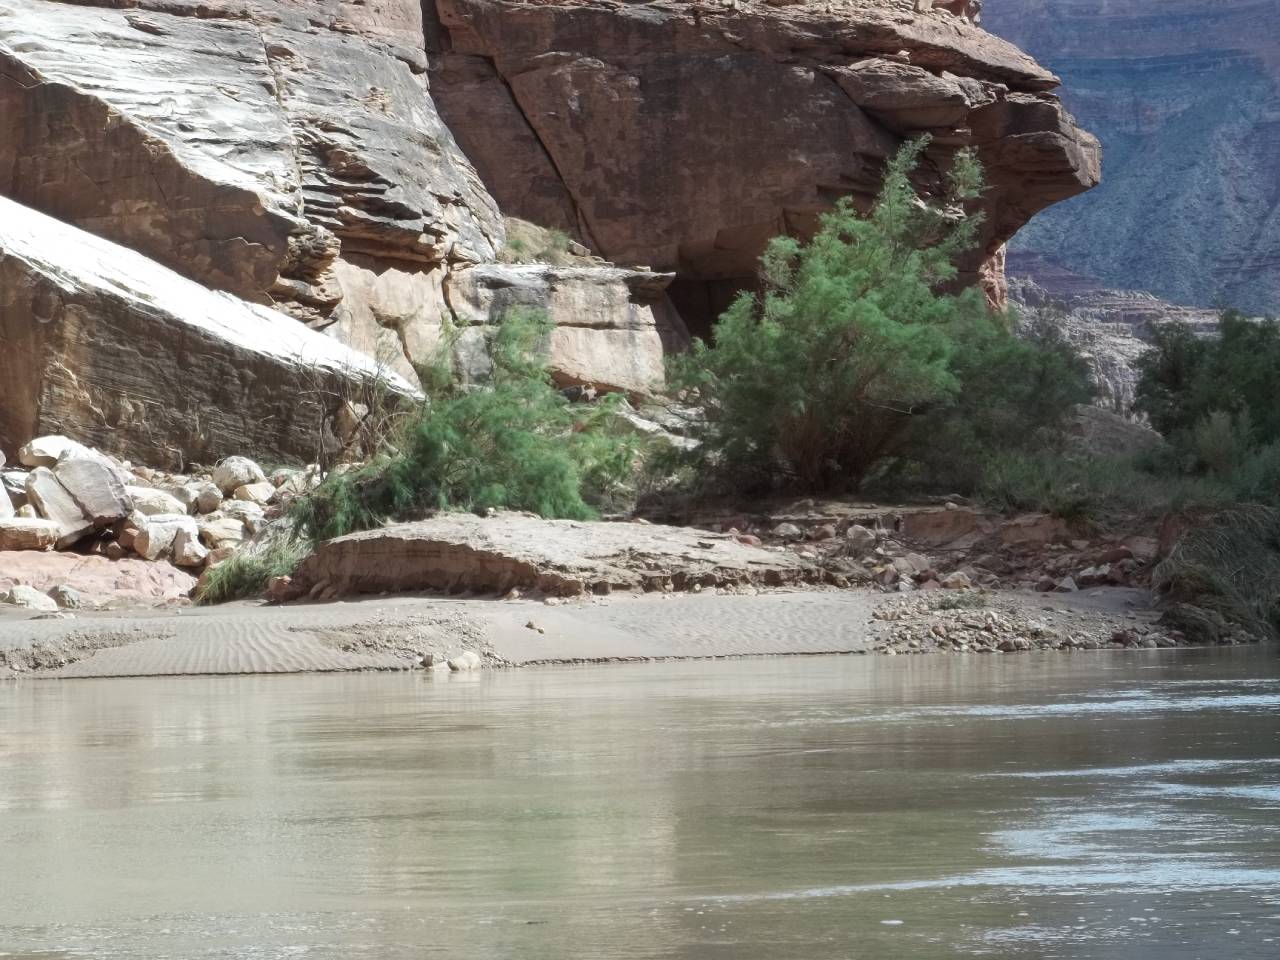
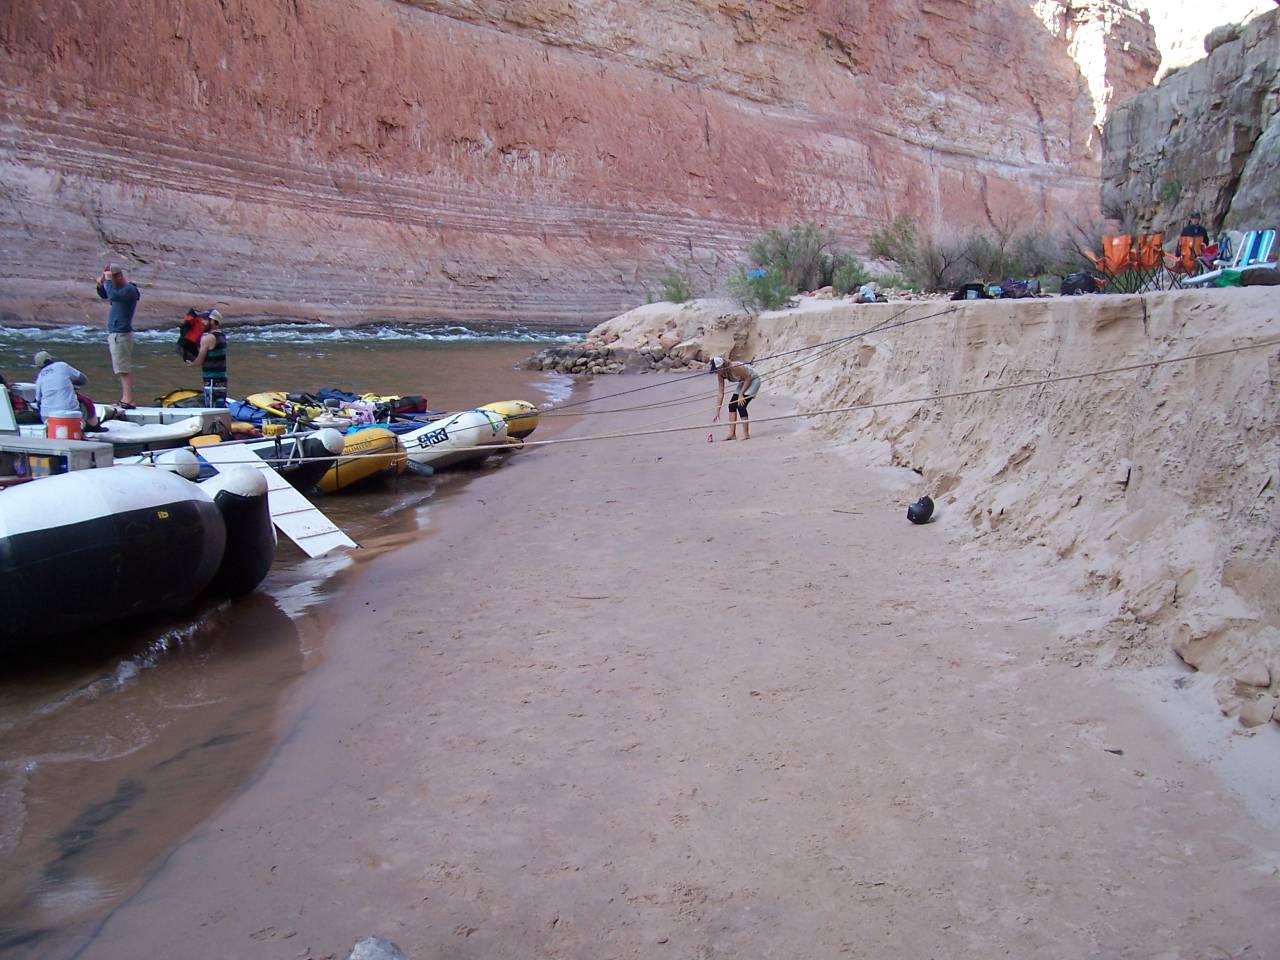
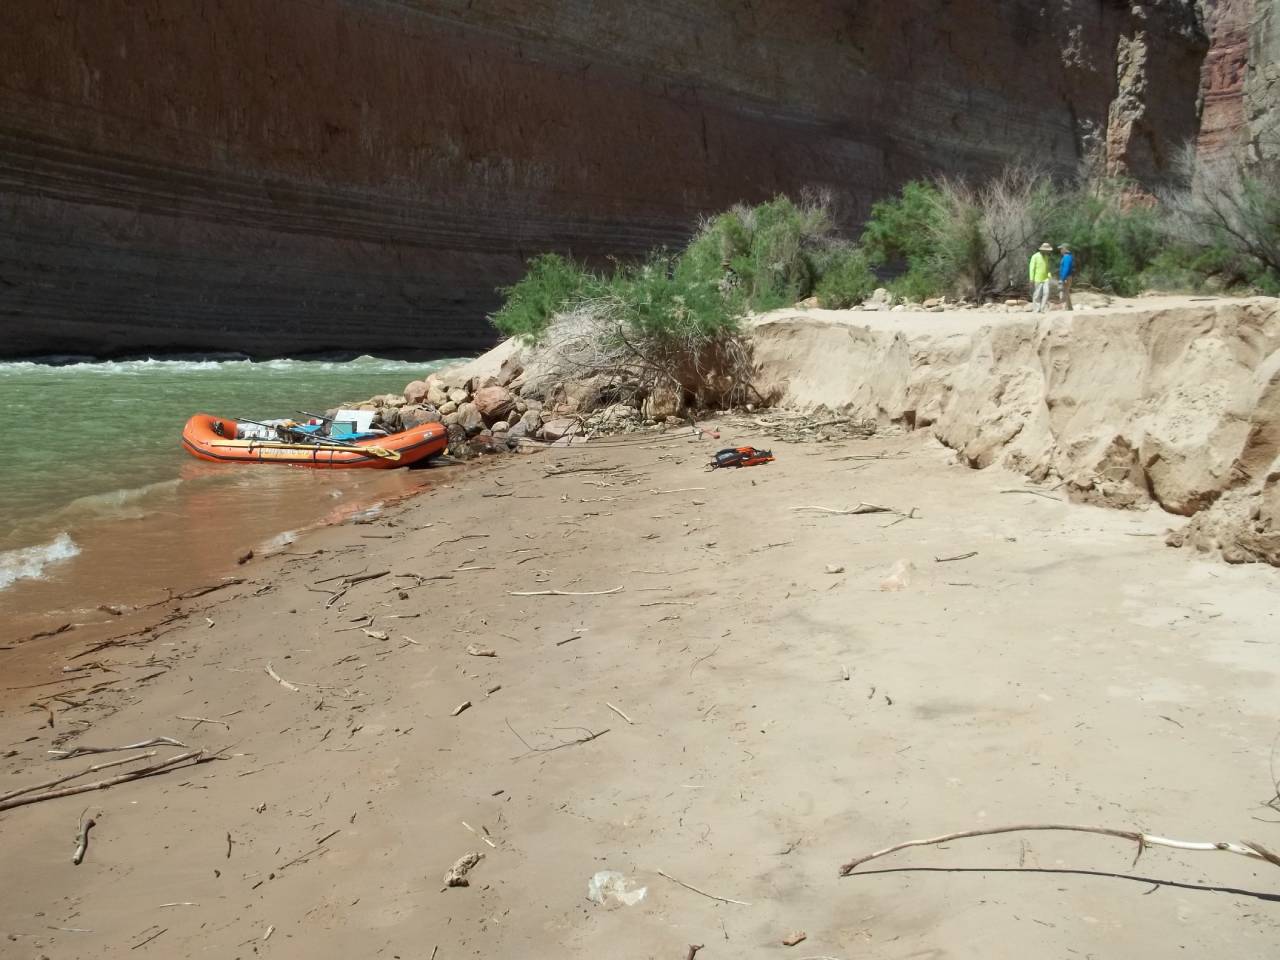
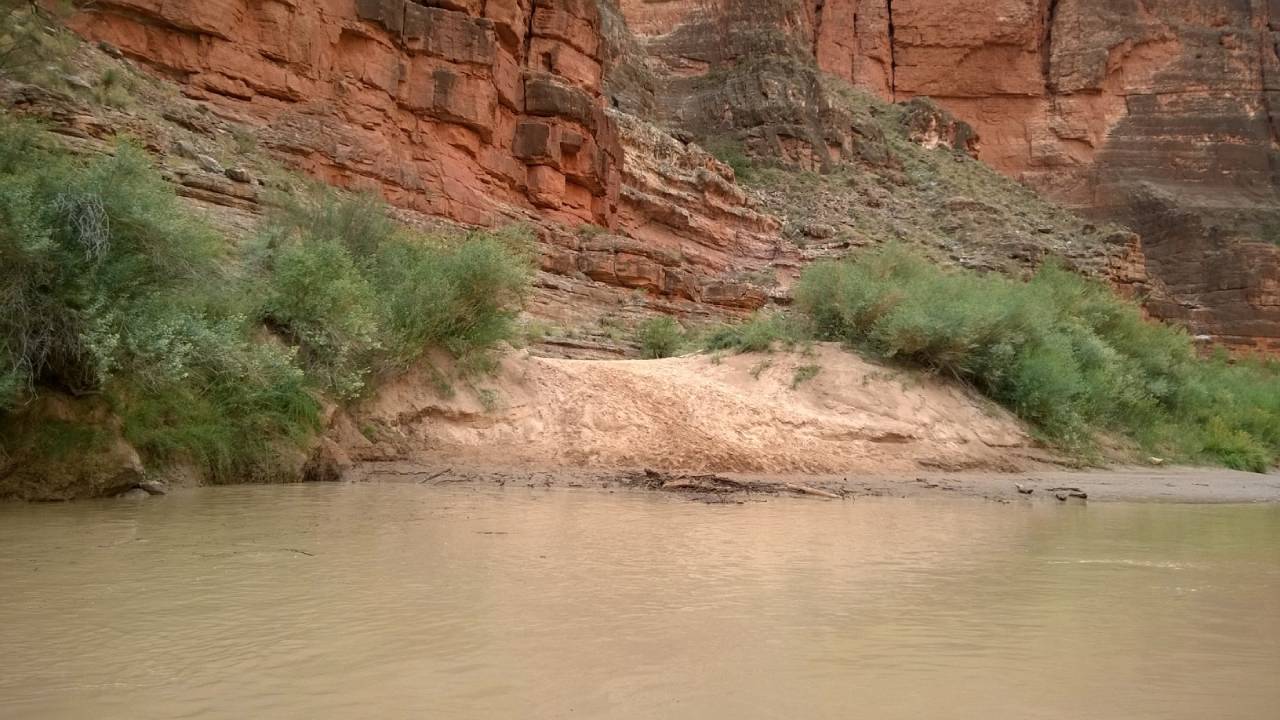
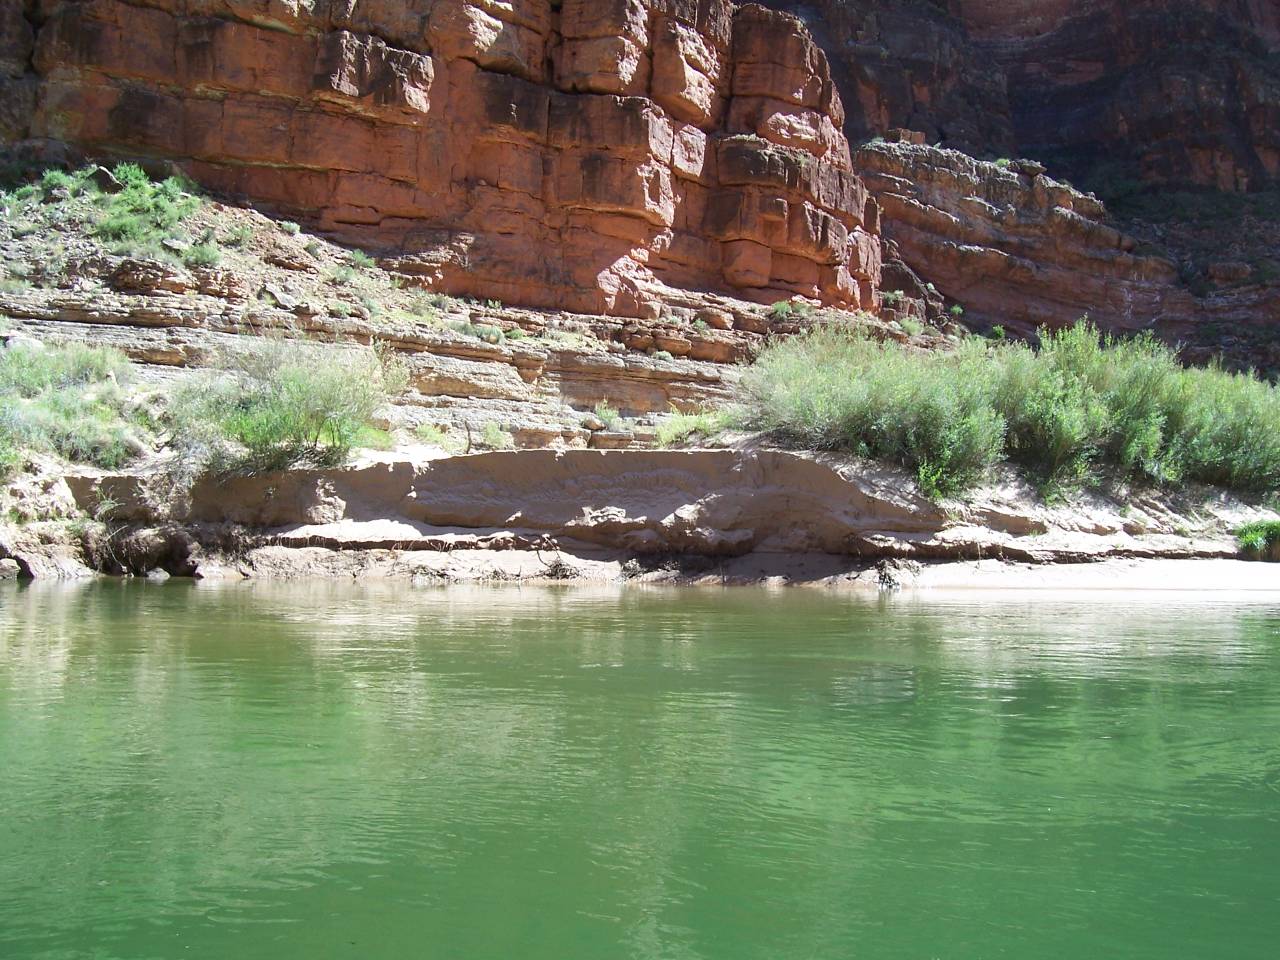
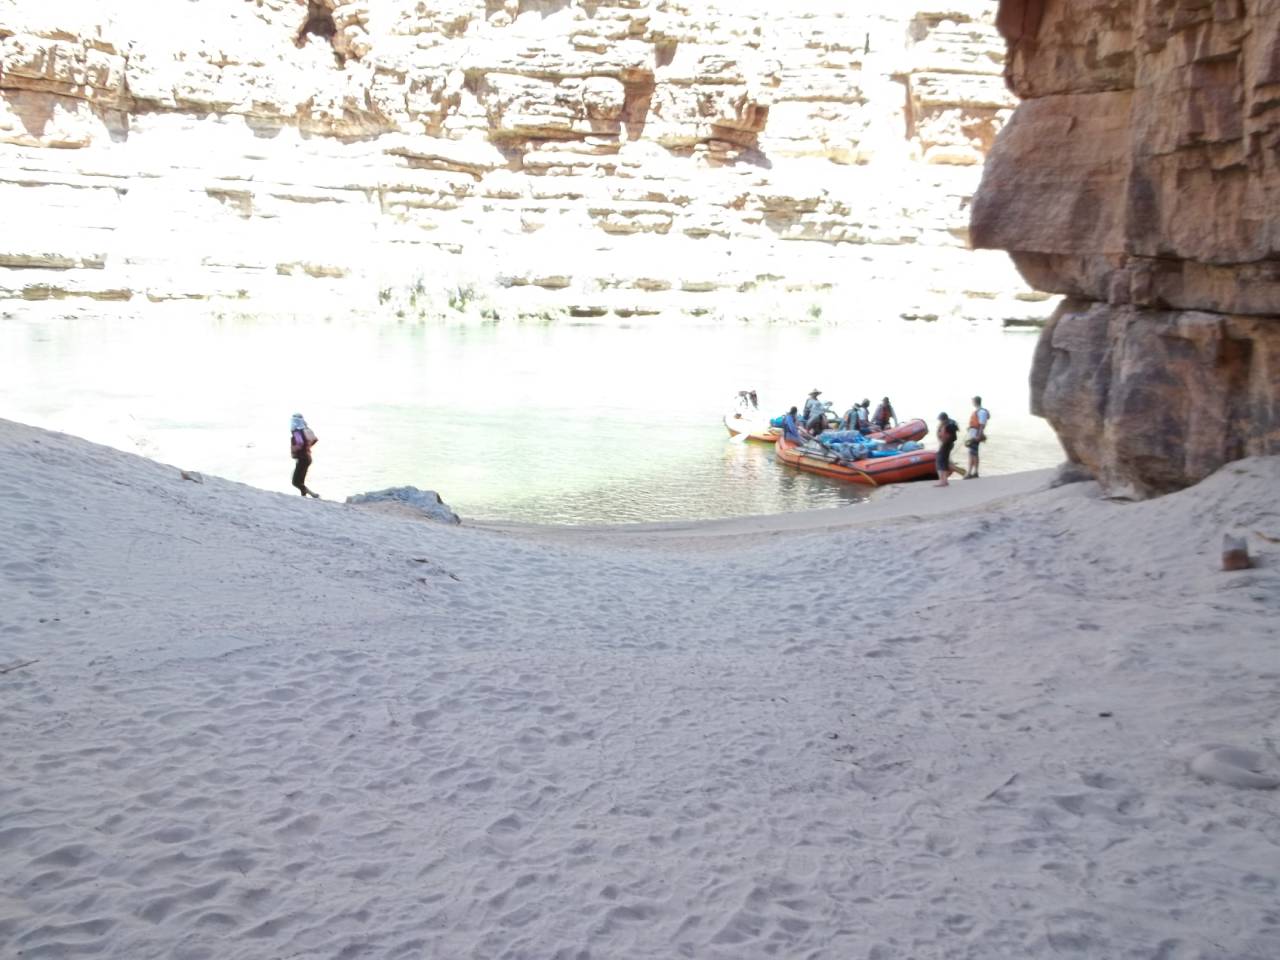
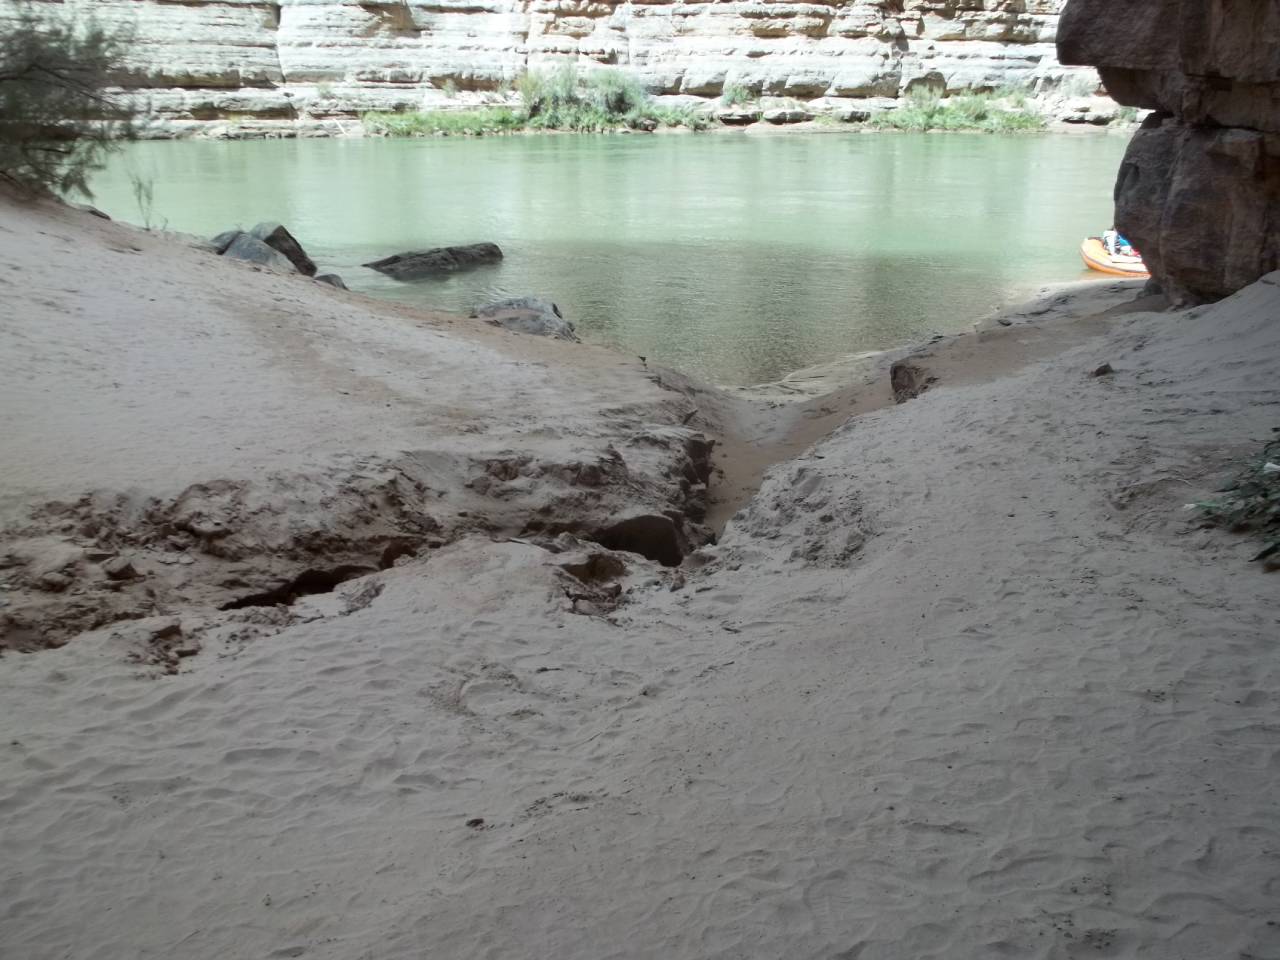
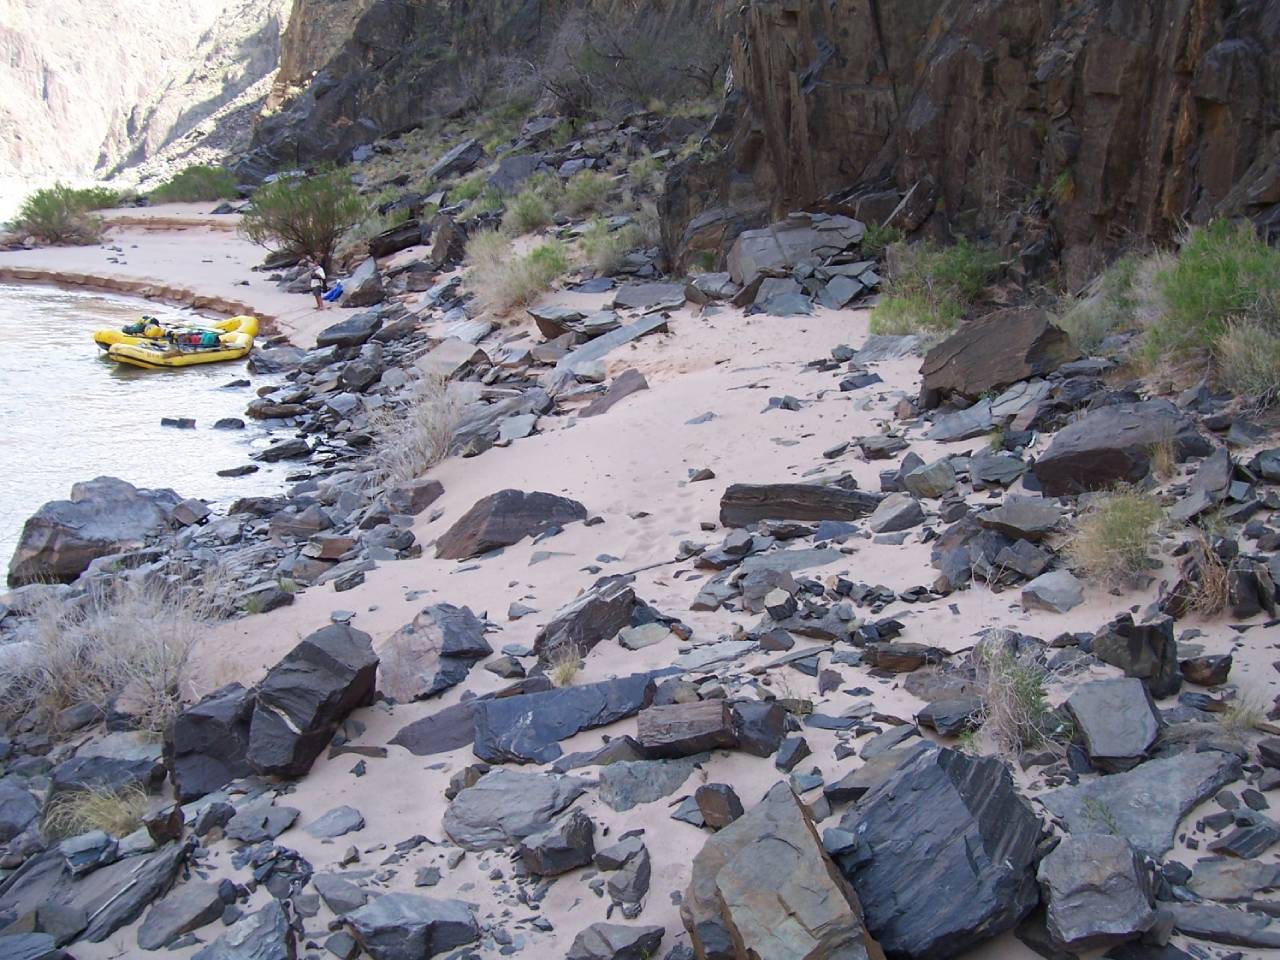
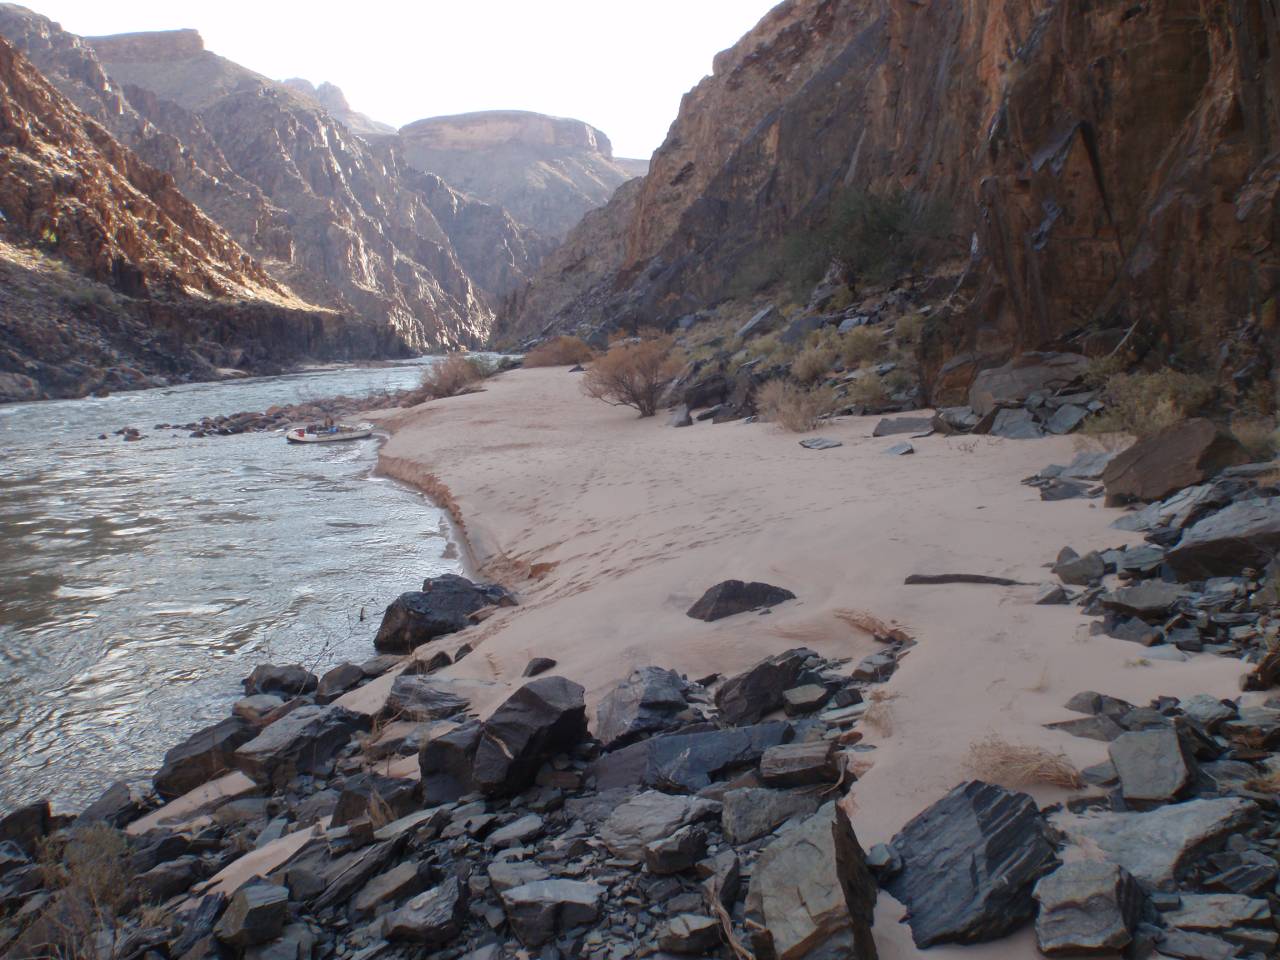
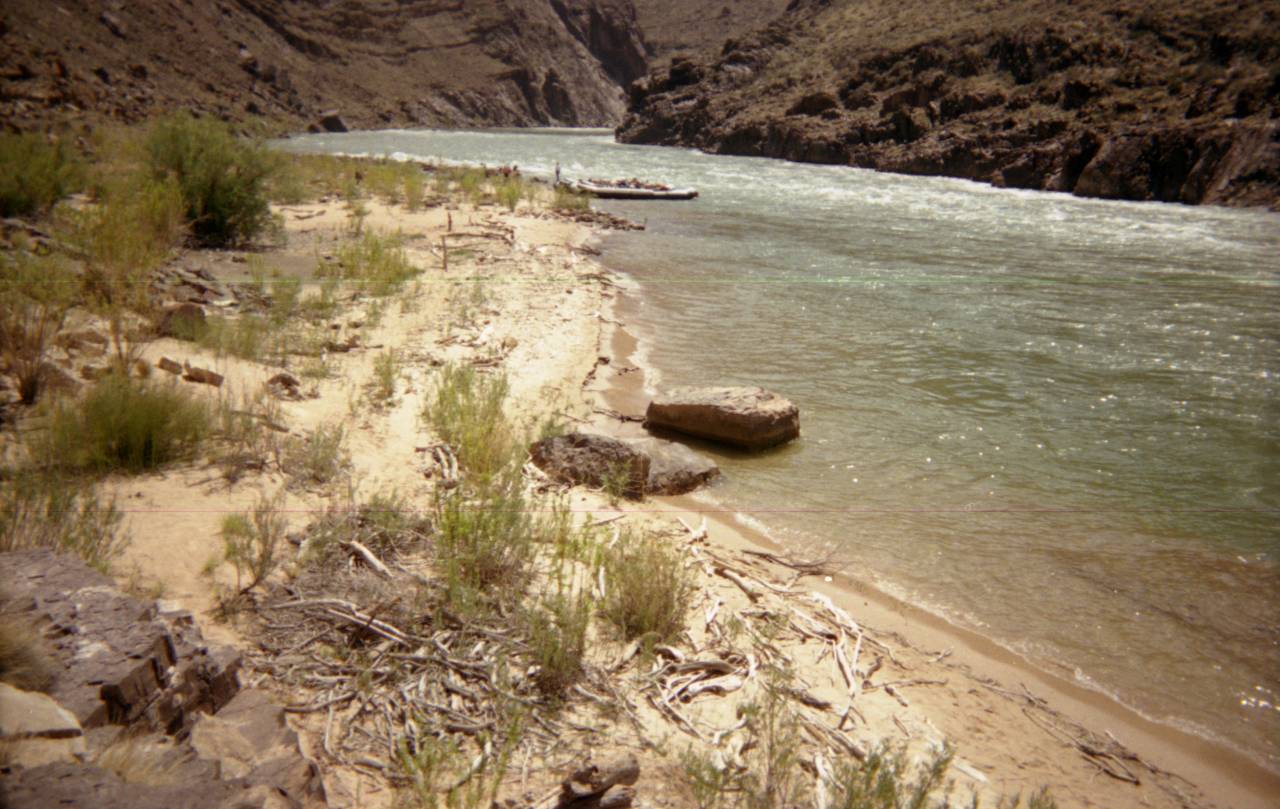
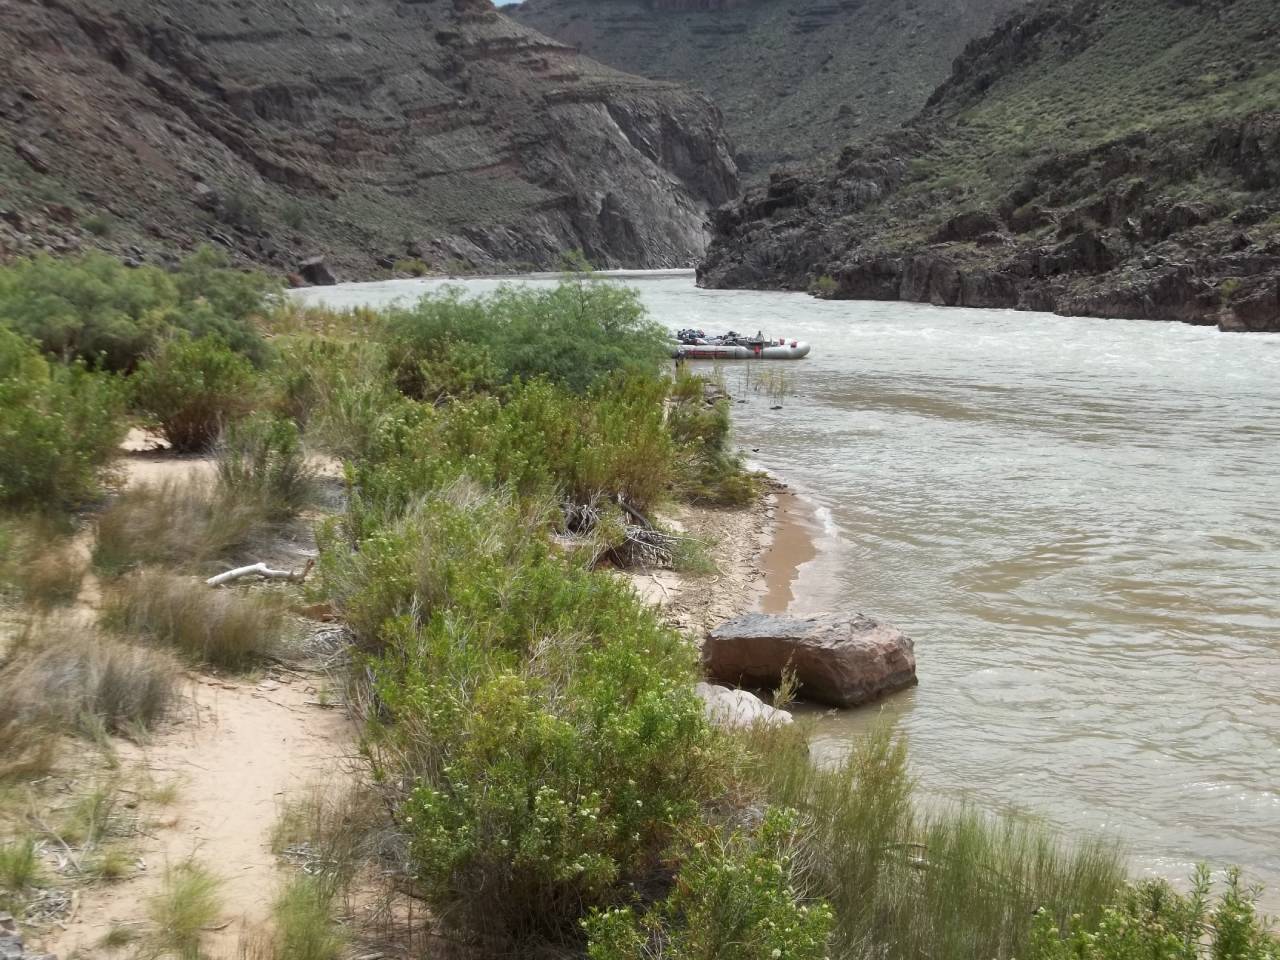
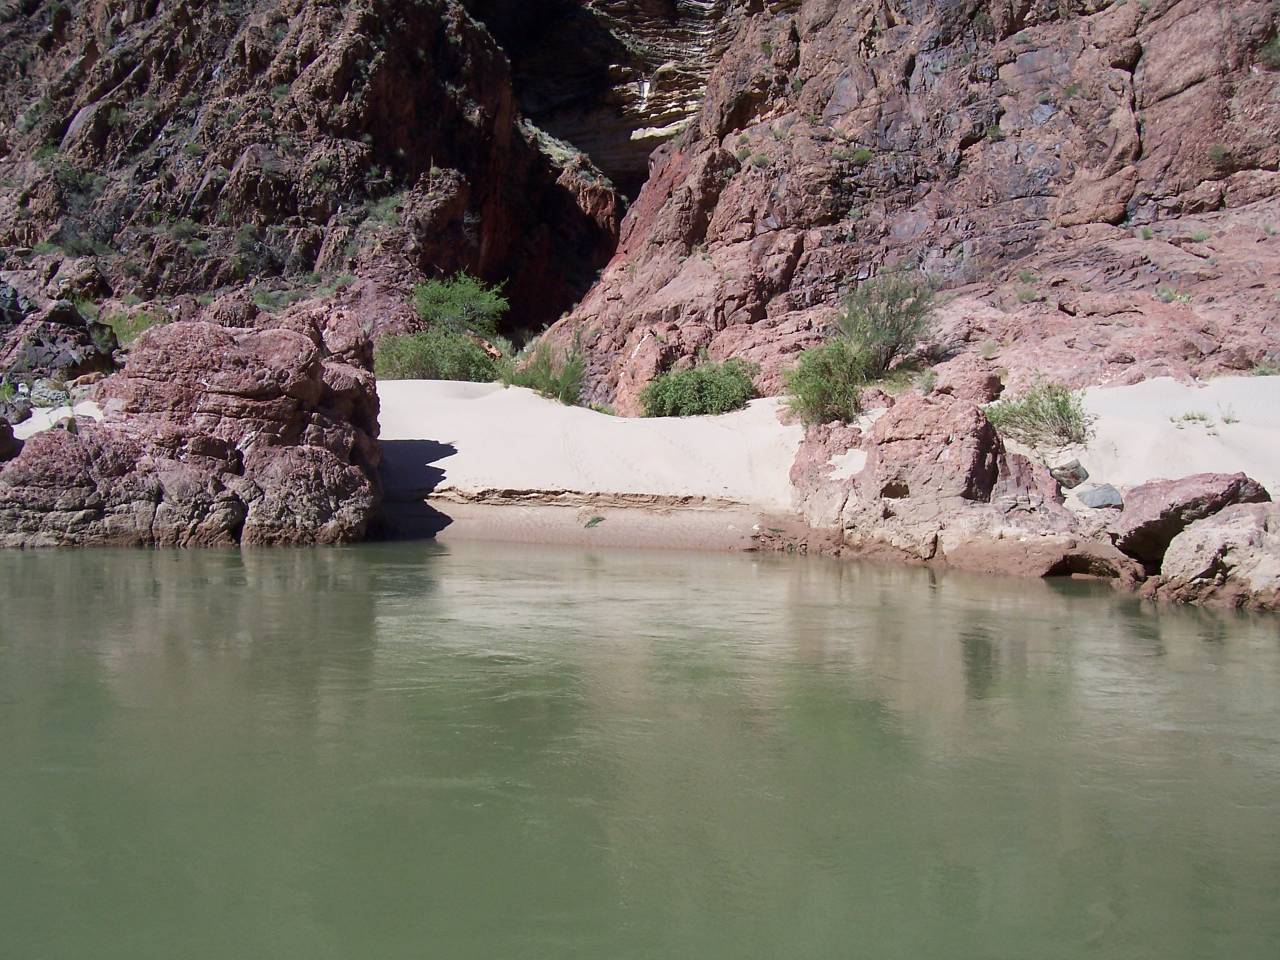
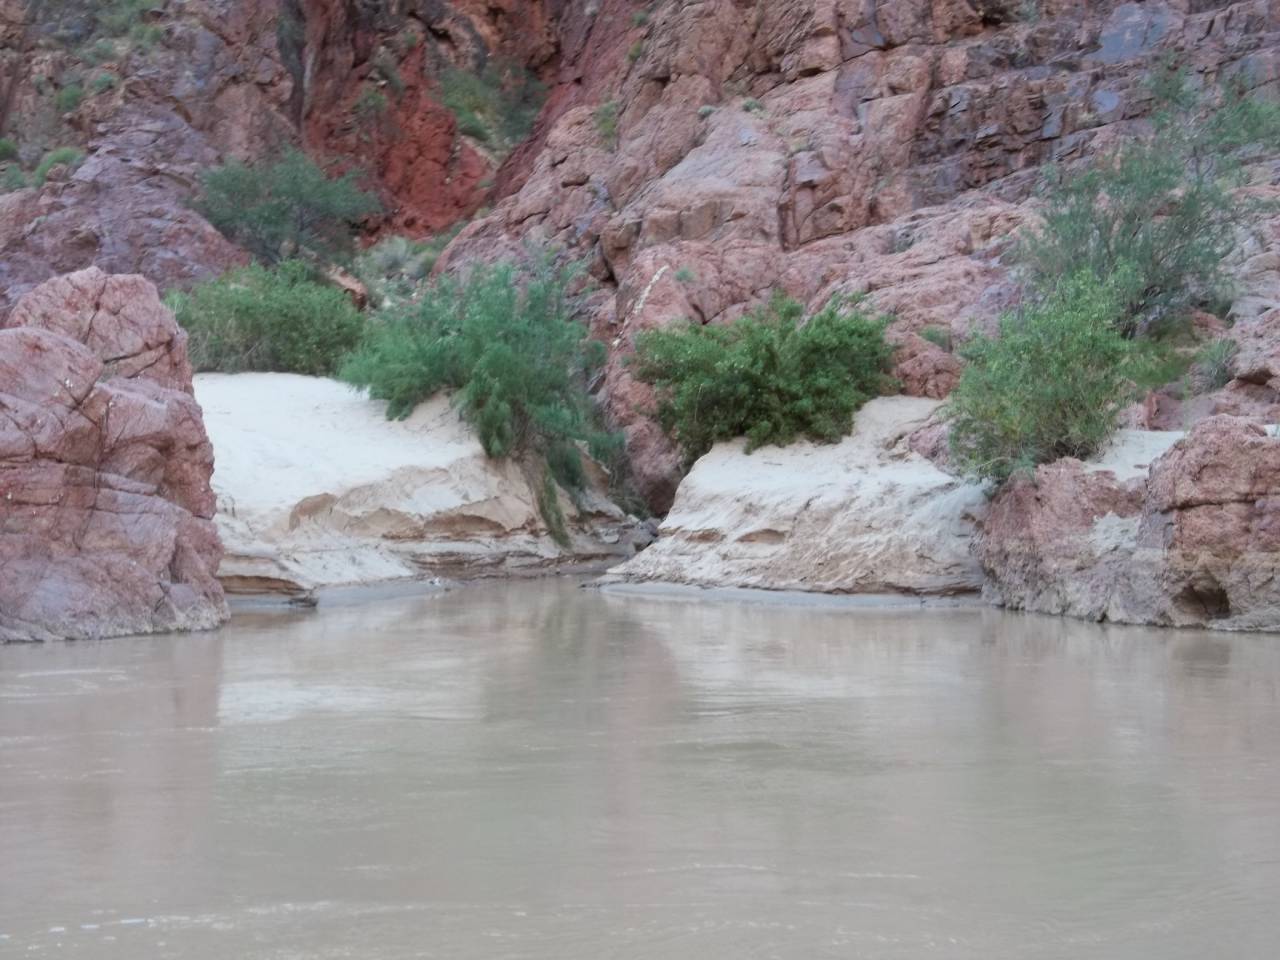
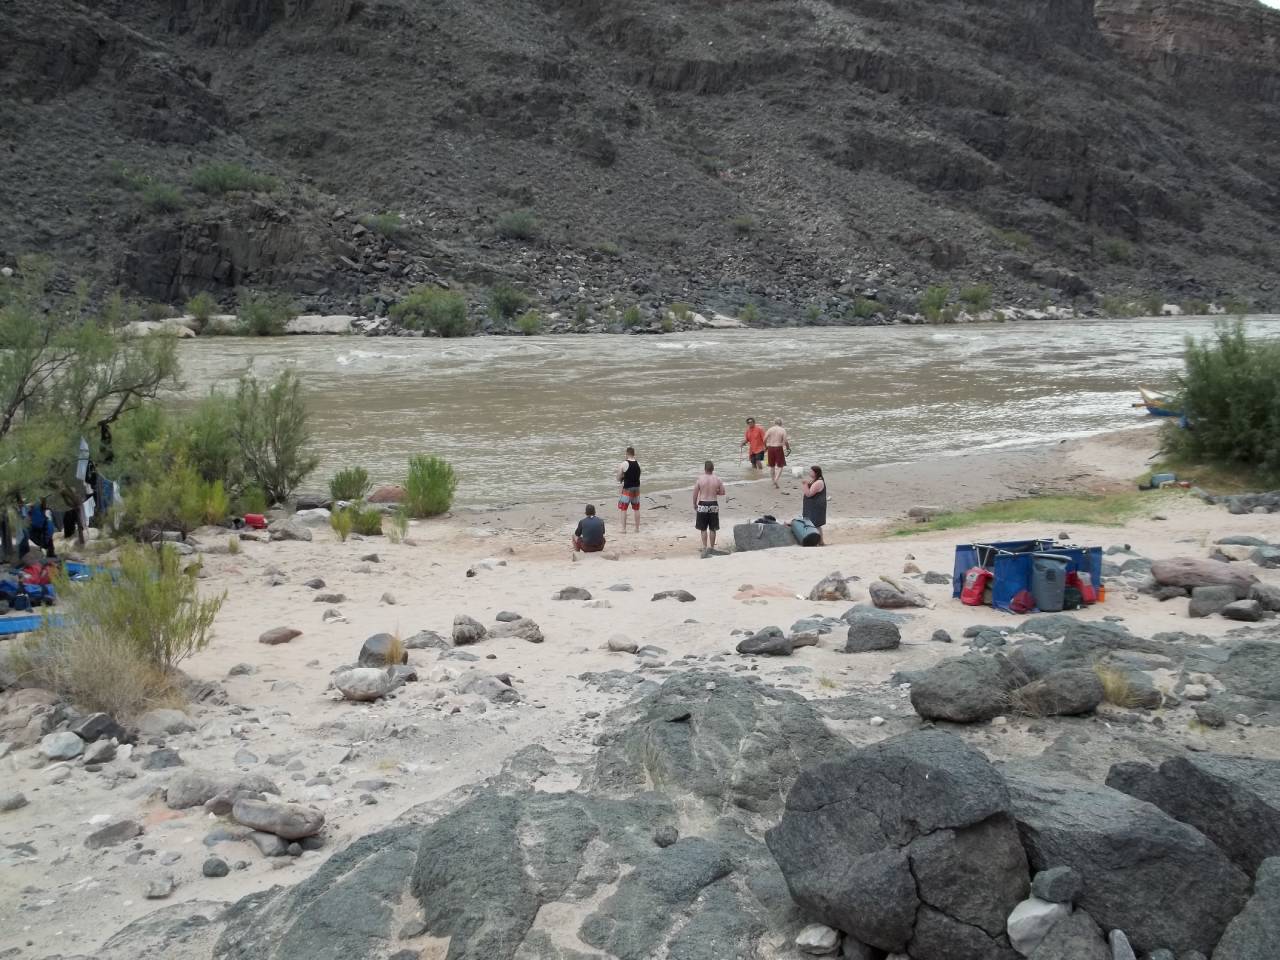
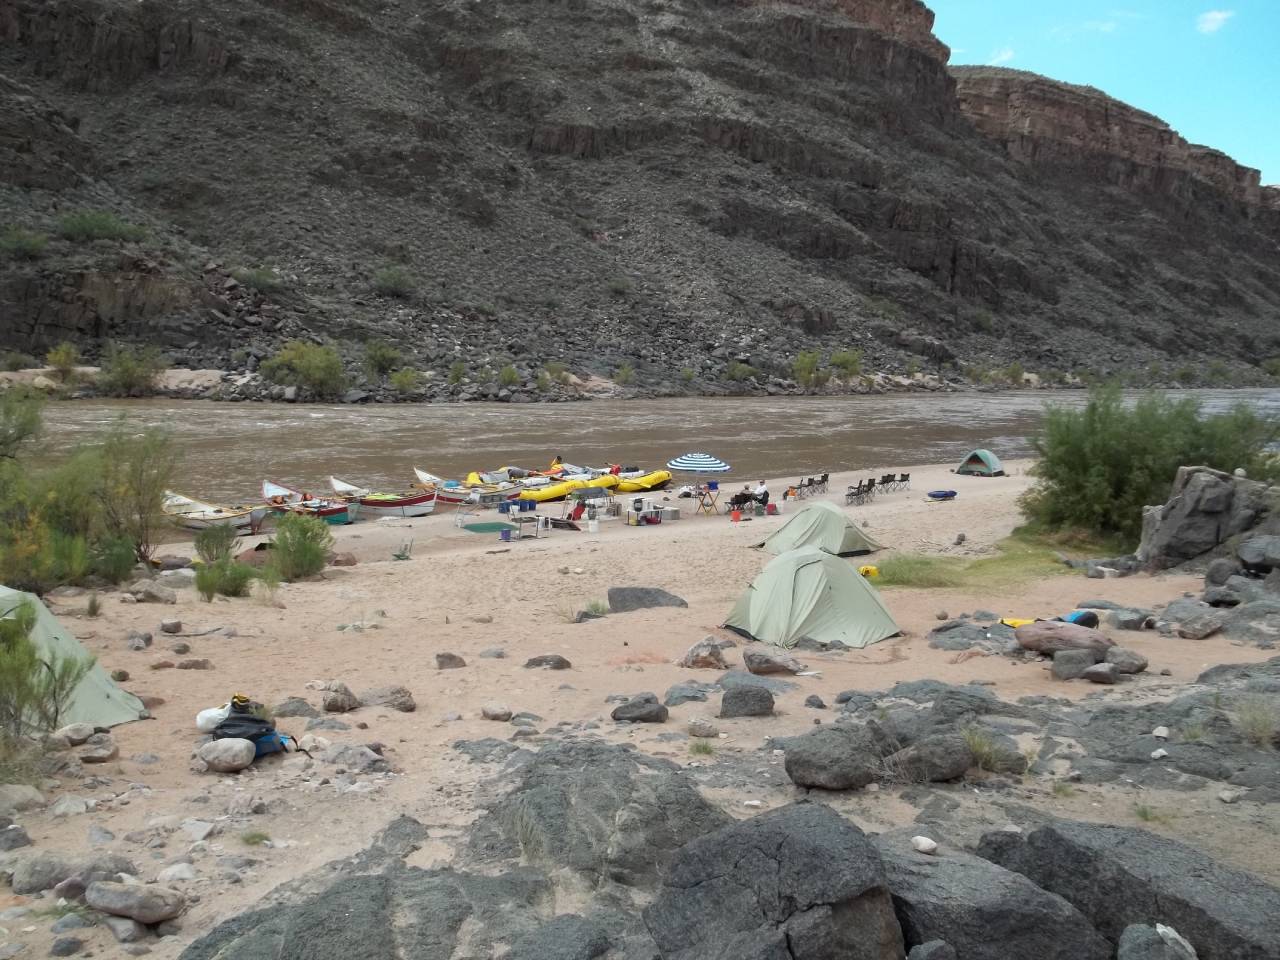
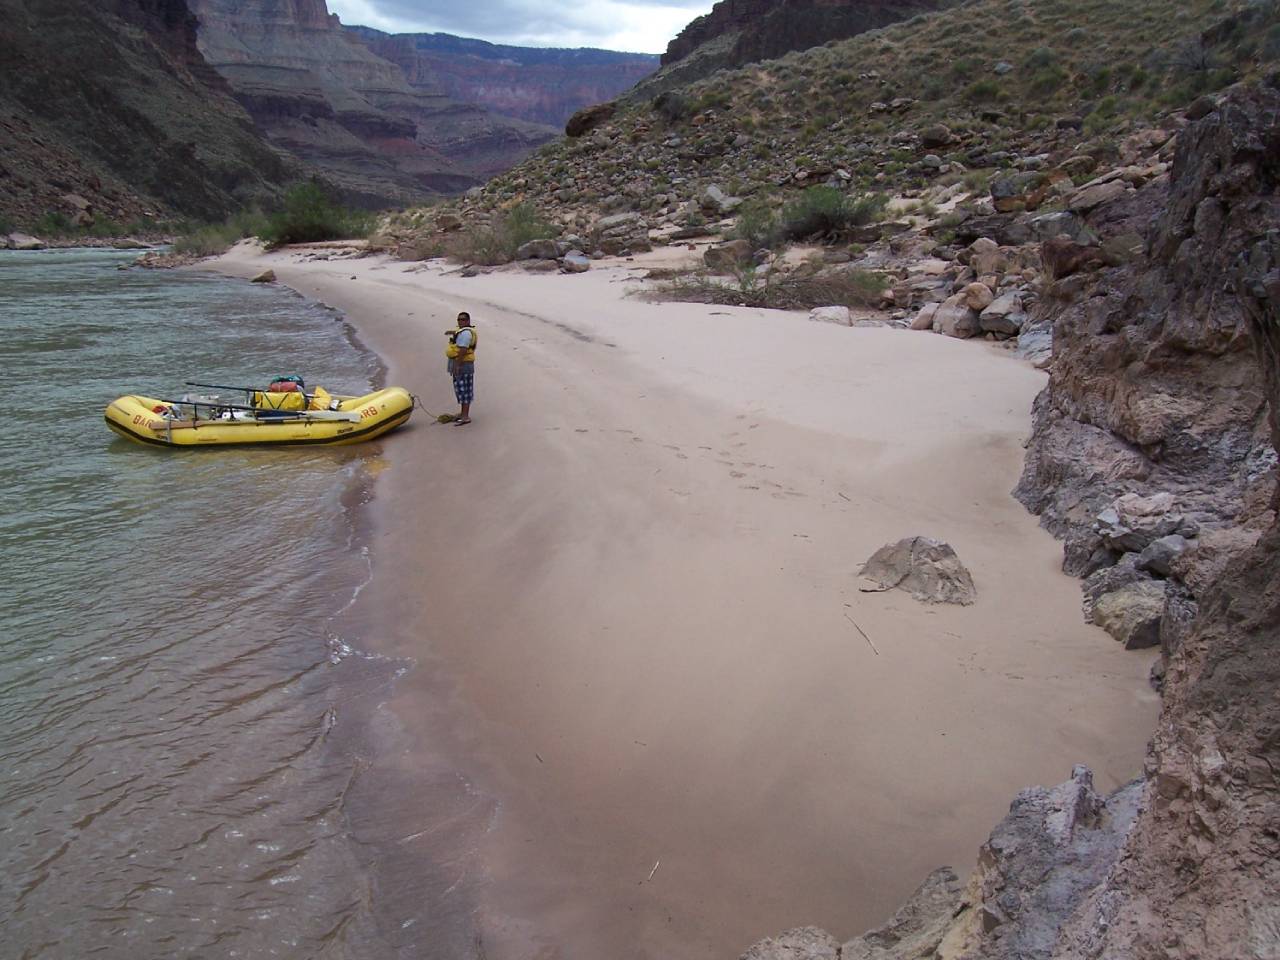
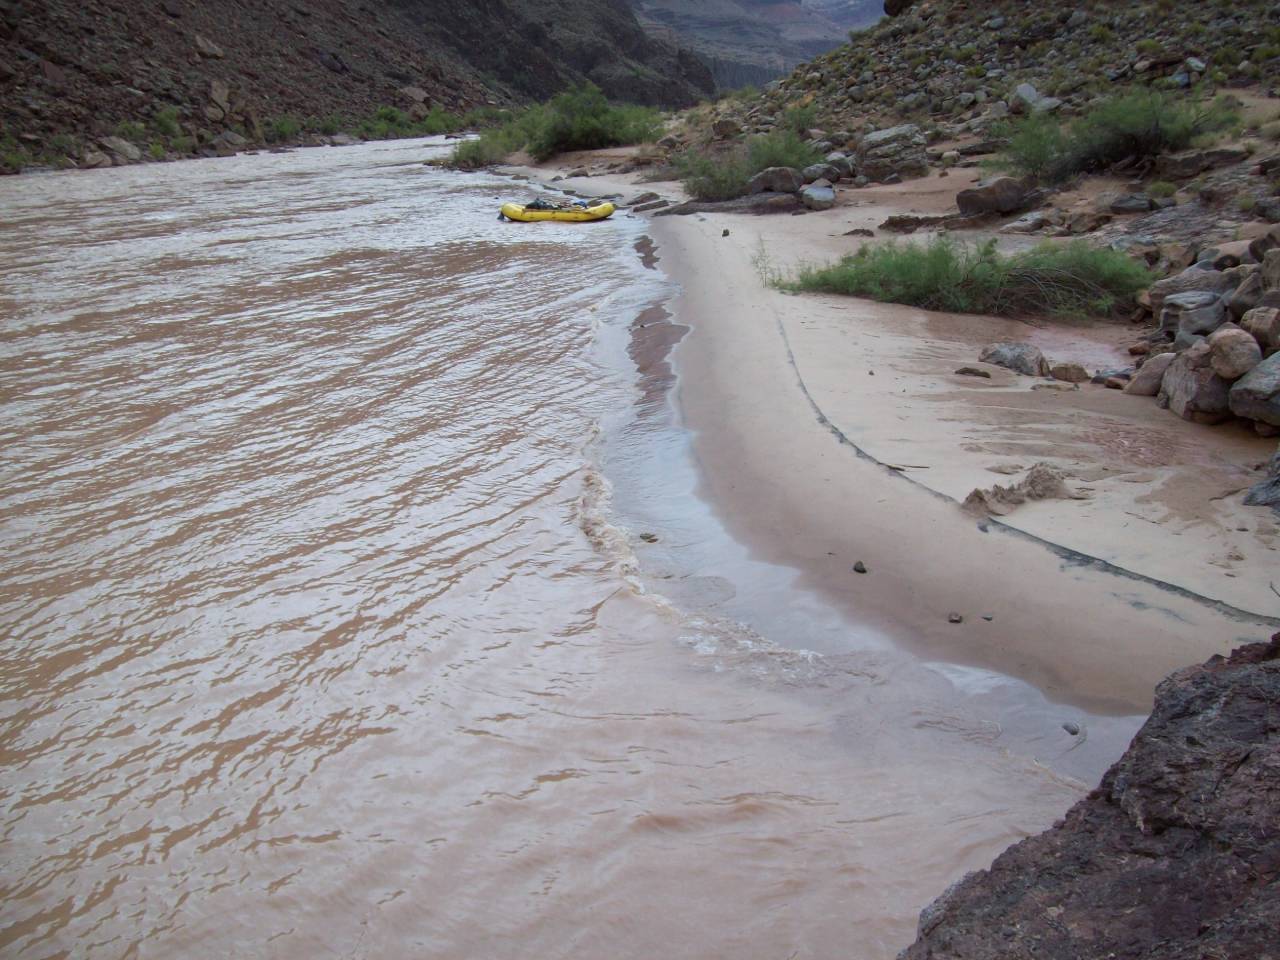
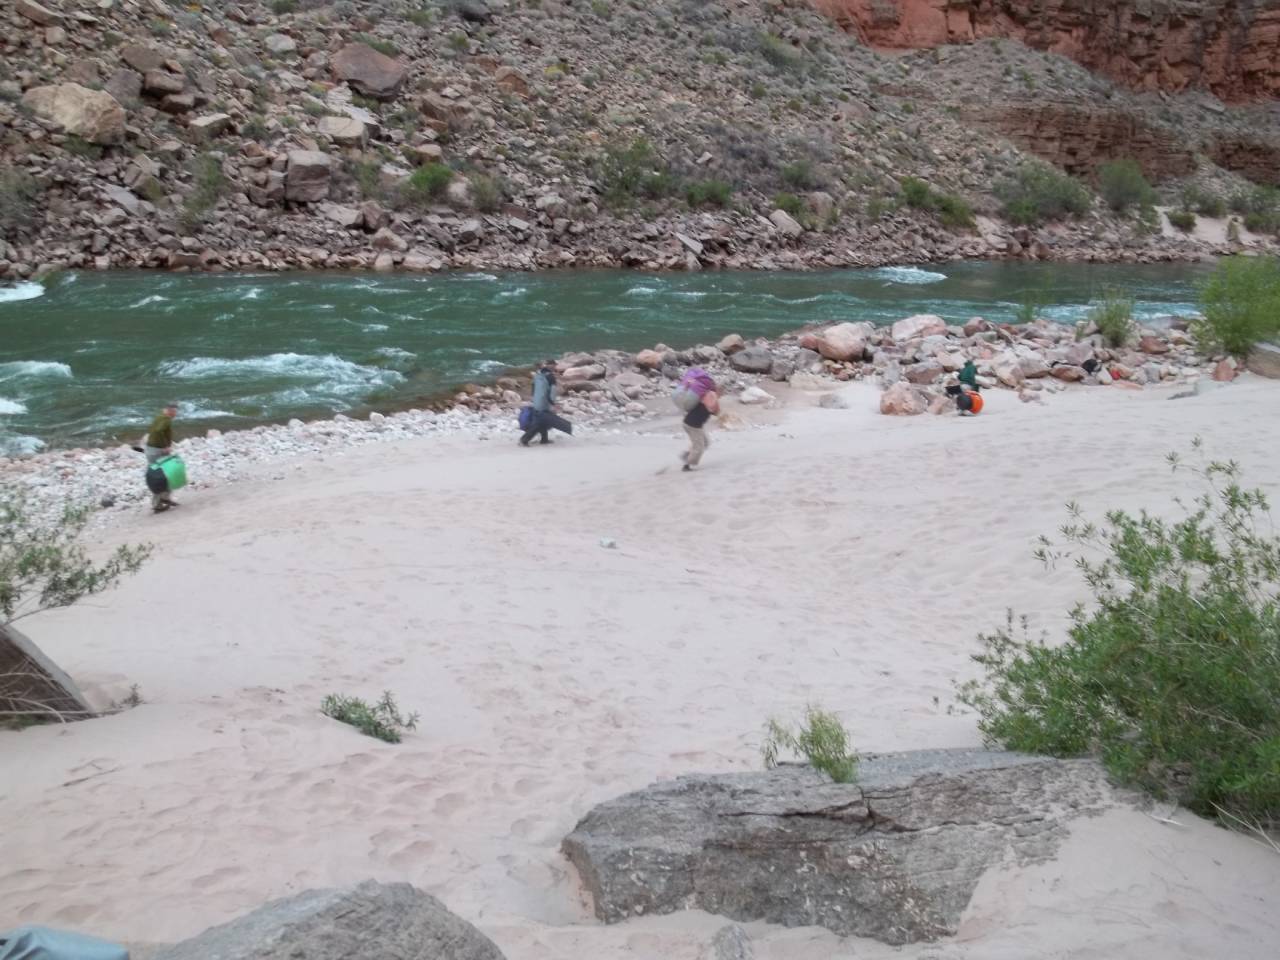
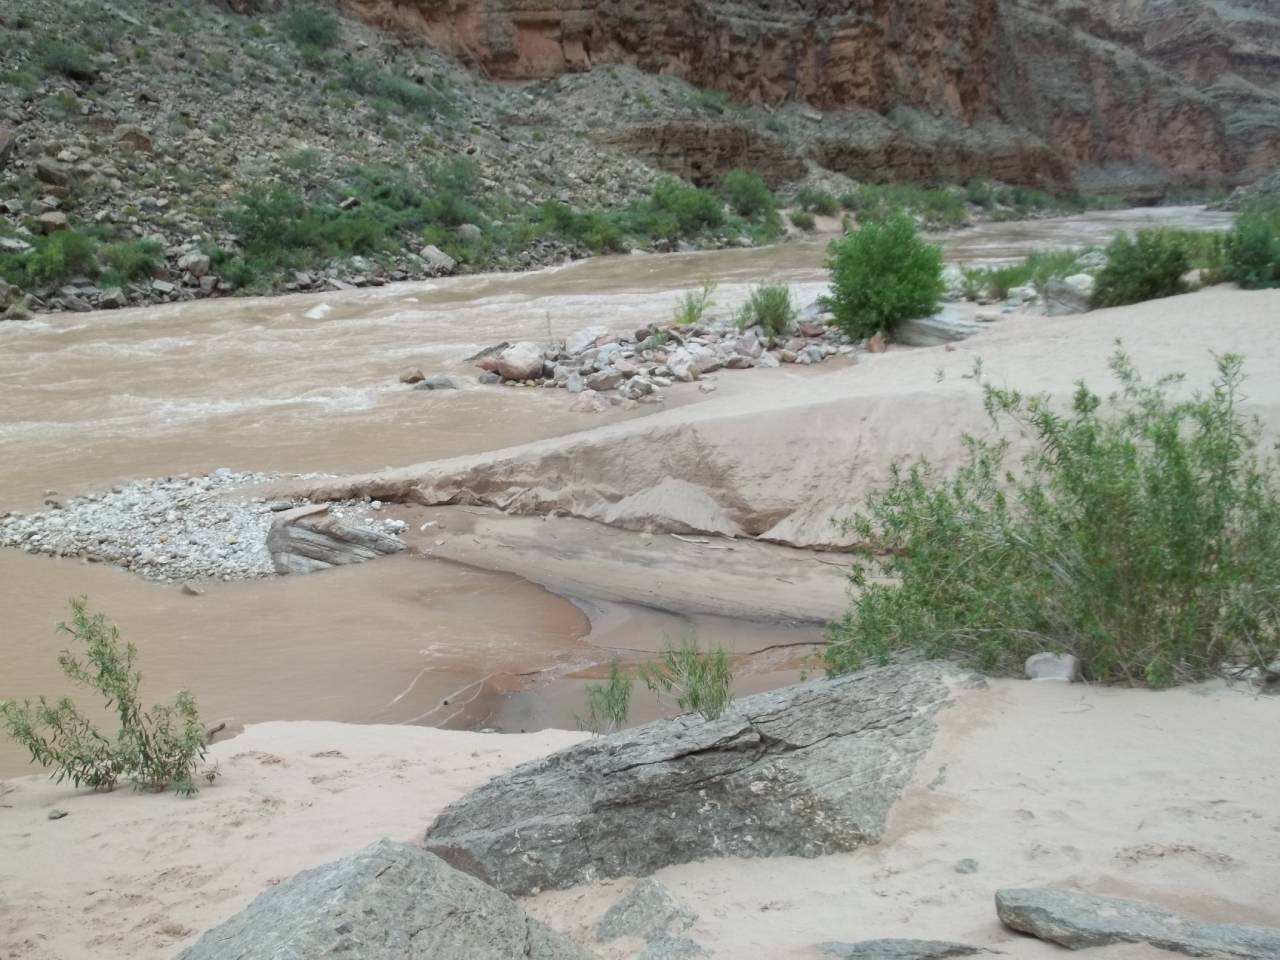
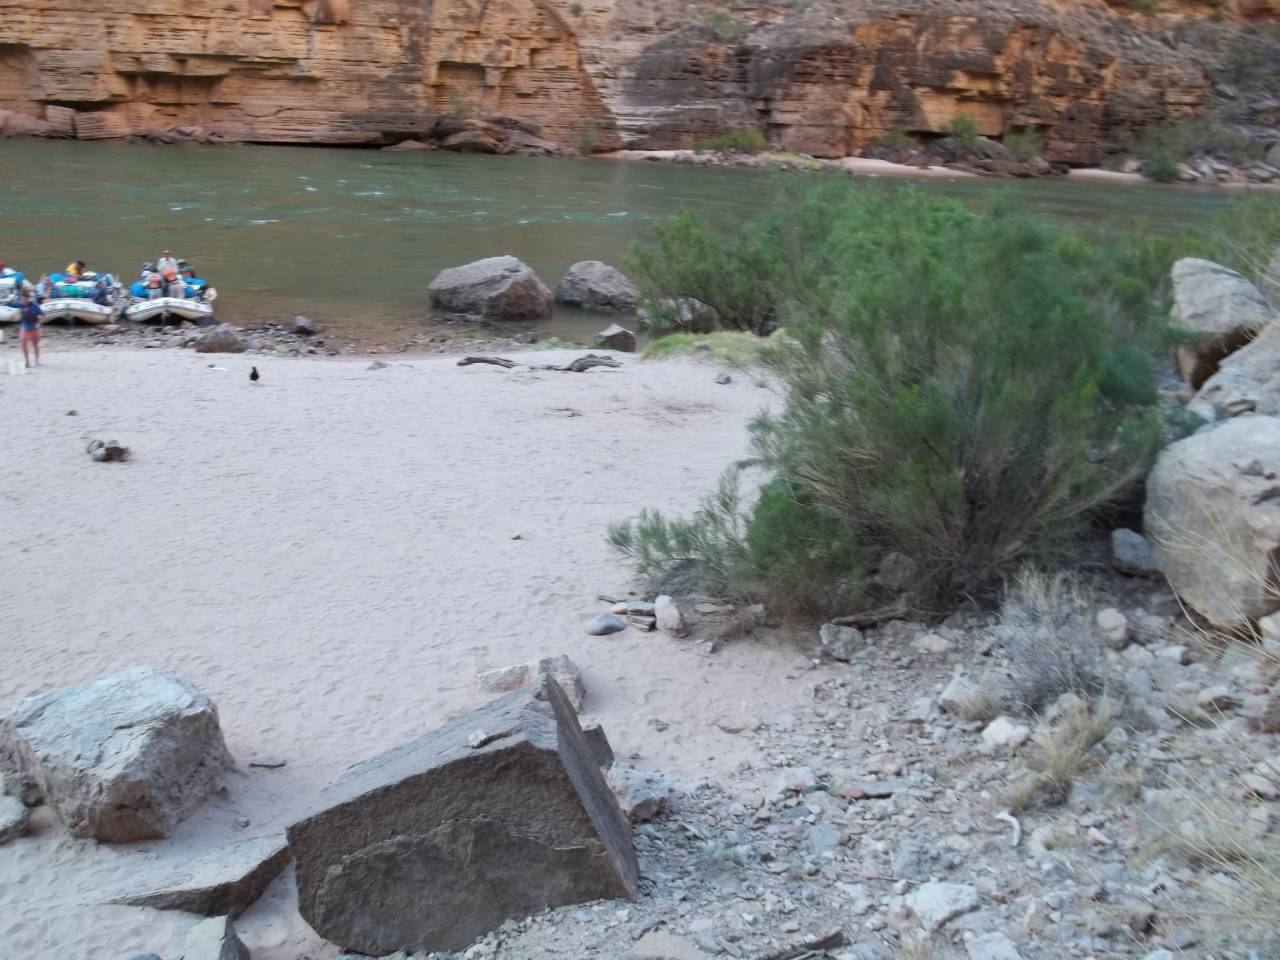
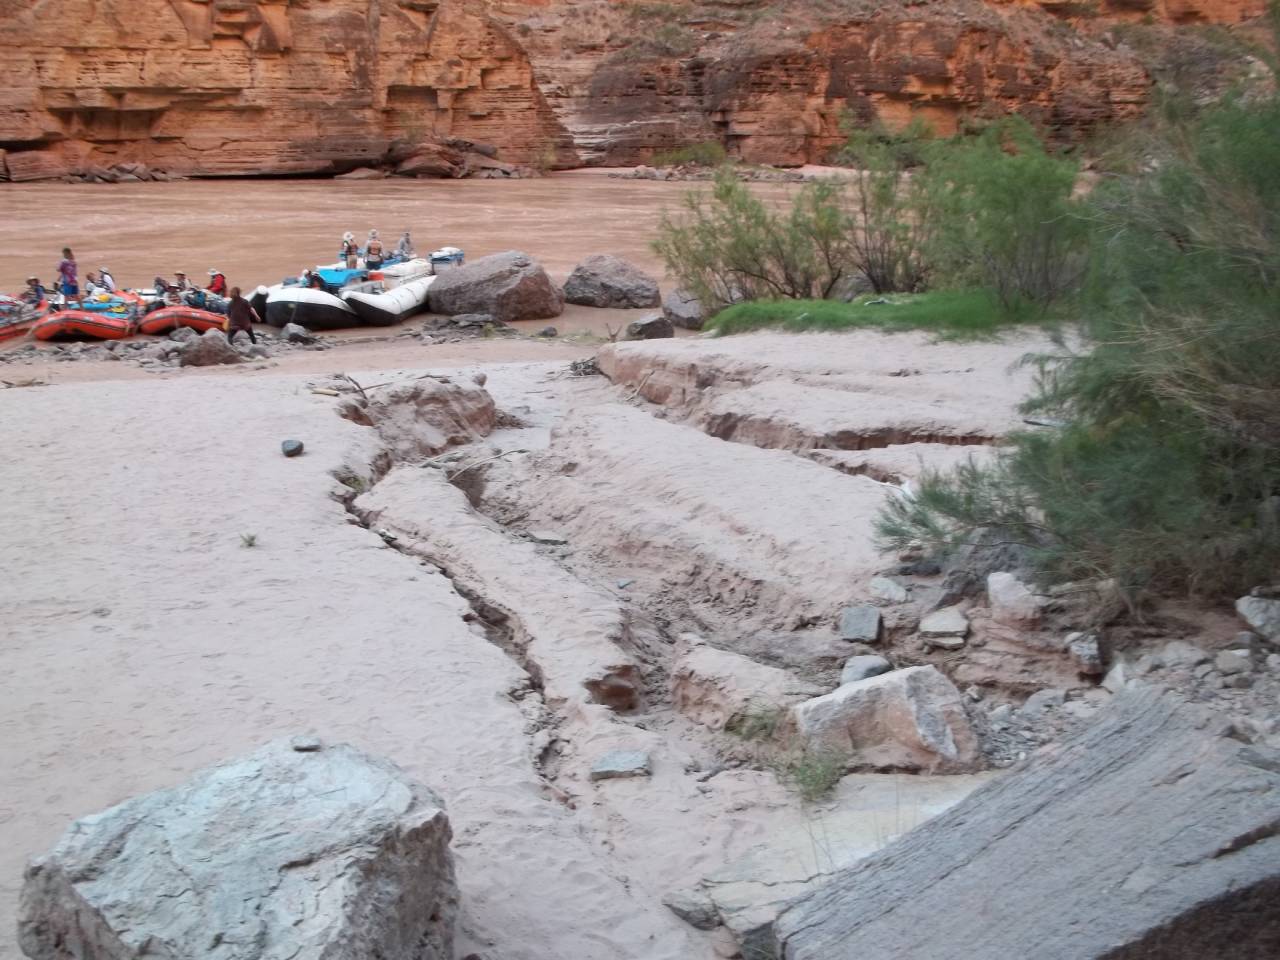
Before-and-after image comparisons showing the effects of water flow from the Glen Canyon Dam.
12.4 Mile L – Below Salt Water Wash
Difference between daily high release in April vs May. This varies by month, so you need to know which camp will/will not be out of the water.
16.3 Mile L – Hot Na Na
Hot Na Na camp before and after rain event. 07/03/2018 - 07/21/2018
29.4 Mile L – Shinumo Wash
No description found
37.9 Mile L – Tatahatso
Tatahatso less than desirable result of HFE and winter flow regime.
38.3 Mile L – Martha’s
Martha’s non-drainage related rain erosion.
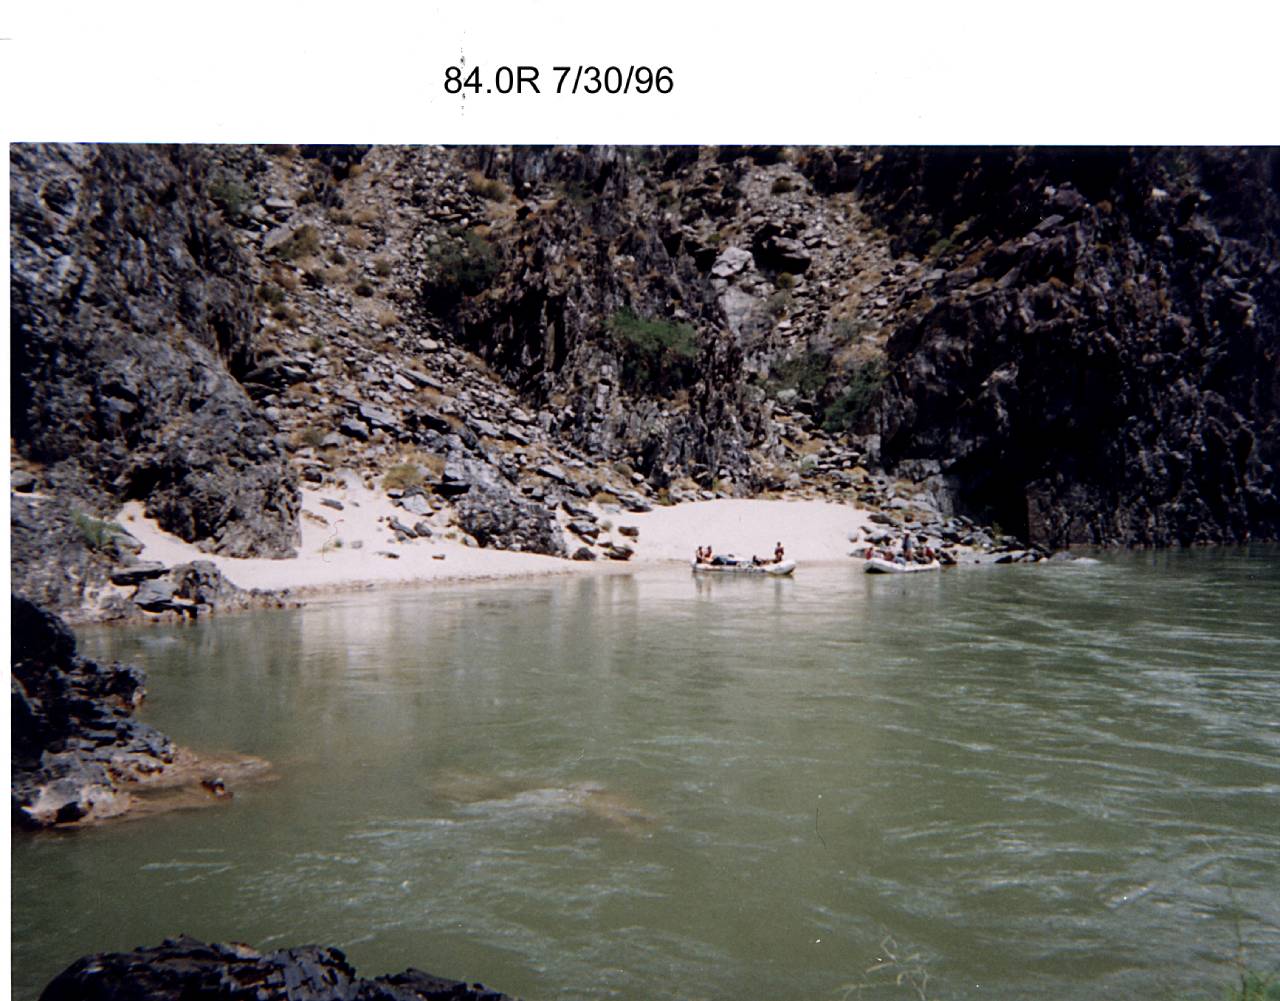
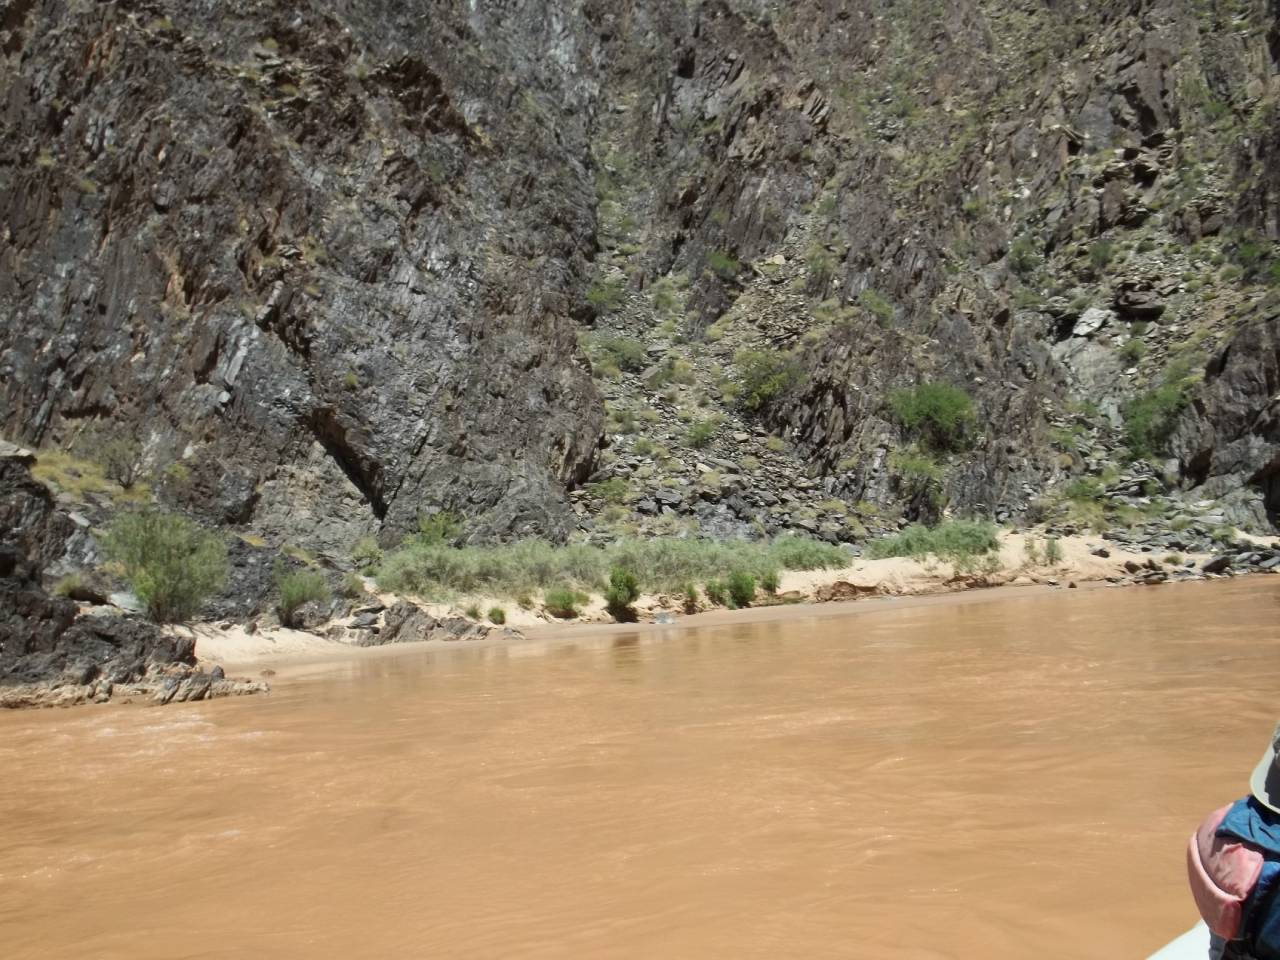
84.0 Mile R – Clear Creek
Clear Creek camp before and after vegetation encroachment. 07/30/1996 - 05/13/2019
84.4 Mile L – Zoroaster
Zoroaster Camp before and after HFE. 04/07/2012 - 12/05/2012
109.4 Mile R – 110 Mile
110 Mile camp before and after vegetation encroachment. 04/22/2000 - 08/25/2015
114.5 Mile R – Lower Garnet
Erosion from rain event that is definitely attributed to the drainage! FYI-this beach is much bigger than it appears in the foreshortened photo.
132.0 Mile R – Stone Creek
Stone Creek Camp difference in camp use area between two normal summer flows.
134.6 Mile L – Owl Eyes
Owl Eyes Camp normal DAILY min/max cfs in July 2012.
145.6 Mile L – Olo
No description found
164.0 Mile R – Tuckup
Rain erosion not related to a nearby drainage. Simply runoff from surrounding cliffs.
* The images in this exhibit were collected by volunteers for the Grand Canyon River Guides Adopt-A-Beach program with support provided by the U.S. Geological Survey Grand Canyon Monitoring and Research Center and the Glen Canyon Dam Adaptive Management Program administered by the U.S. Department of the Interior Bureau of Reclamation.